 PrecisionRifleBlog.com A DATA-DRIVEN Approach to Precision Rifles, Optics & Gear

Related Articles



We are halfway through the 2026 IPRF World Championship! Before the match, I published predictions based on historical performance. Now we are halfway through the match, with each of the 274 competitors having the chance to complete 10 stages and 100 possible impacts. That gives us a much more direct look at how they are performing at this particular venue.
Each competitor will complete another 10 stages over the next two days before the winners are crowned.
One thing jumped out at me when I checked the Day 1 results from the 2026 IPRF World Championship: the top 7 shooters in the Military/Law Enforcement Division were exactly the 7 people the original model gave more than a 1% chance of winning. All seven!
That got me wondering how the predictions were holding up in the other divisions. There were some equally interesting alignments between the forecast and the actual results, along with a few shooters the model clearly underestimated.
This time, I’m sharing the entire prediction spreadsheet. It includes an updated projected finish and final hit % for every competitor with a scored first half, plus each shooter’s chance of winning their division. It also preserves the full original predictions so you can make your own comparisons.
What Changed In The Predictions
The updated analysis model keeps each shooter’s first-half score fixed and simulates the remaining 10 stages 500,000 times (using a Monte Carlo simulation). Those simulations combine the historical model with the scores already recorded, the difficulty of individual stages, and uncertainty about performance and conditions during the second half. A 30% winning probability means that the shooter won 30% of the simulated matches for that division. (Read the previous article for more details)
There is an important complication: the Open Division shot its first half on September 25, while all of the other divisions shot theirs on September 24. Not all of the divisions shot the same stages, either. Open shot the same ten odd-numbered stages on September 25 that Mil/LEO, Limited, and Junior shot on September 24. Factory, Ladies, and Senior shot the ten even-numbered stages on September 24. That means some comparisons involve different shooting conditions, while others also involve different stages.
The update accounts for the different stage sets and allows for session conditions, but those scores alone cannot tell us precisely how much was weather versus another factor. Within-division comparisons are the cleanest way to judge how the original predictions are doing.
Across the whole field, the updated projected hit % put Austin Buschman first at 93.4%, Morgun King second at 92.9%, and Kahl Harmon third at 92.5%. Those are estimates over all 200 possible impacts. The combined ranking helps compare the field, but winning an official title still happens solely within a shooter’s division.
Here are the two highest winning probabilities in each division after the first half. The spreadsheet includes everyone, including shooters whose chances are below 1%.
| Division | Leading favorite | Win odds | Next contender | Win odds |
| Open | Austin Buschman | 38.0% | Morgun King | 29.1% |
| Limited | Chad Heckler | 46.3% | Kyle McCormack | 31.8% |
| Factory | Keith Rudasill | 64.5% | Matt Caruso | 30.9% |
| Mil/LEO | Kahl Harmon | 58.8% | Hunter Zwiers | 30.0% |
| Ladies | Kate Estes | 68.0% | Lauryl Akenhead | 30.2% |
| Junior | Dylan Bailey | 30.2% | Johan Nel | 21.6% |
| Senior | Dale Rhoads | 70.7% | Lee Pettross | 25.1% |
These are chances of winning the final division title. Only the two leading contenders per division are shown here; the workbook includes the remaining probabilities.
Where The Original Forecast Lined Up with The Scores
Every halfway division leader, including all shooters tied for a lead, was on the original published contender list. That is encouraging. It also does not mean the model got the order right, or that every favorite performed as expected. Looking at each division makes the differences much easier to see.
Military and Law Enforcement
This was the comparison that first caught my attention. The original model’s top two were Kahl Harmon and Hunter Zwiers. They now share the lead at 93 impacts, and the other five published contenders fill the next five positions.
| Shooter | Day 1 hits | Original win odds | Updated win odds |
| Kahl Harmon | 93 | 55.5% | 58.8% |
| Hunter Zwiers | 93 | 13.9% | 30.0% |
| Nelson Drolet | 91 | 2.3% | 5.5% |
| Adam Jernström | 89 | 3.1% | 2.4% |
| Sam Trevino | 88 | 6.6% | 2.1% |
| Logan McGinnis | 87 | 5.7% | 1.1% |
| Etienne Vachon | 84 | 4.1% | 0.1% |
The biggest change is Hunter closing the gap. His winning probability has more than doubled, from 13.9% to 30.0%. Kahl remains the favorite at 58.8%, reflecting his historical performance as well as the current tie. Nelson Drolet has also moved up, with 91 impacts and a 5.5% chance of winning. The model identified this group very well, but the first half has changed how the odds are distributed within it.

Ladies
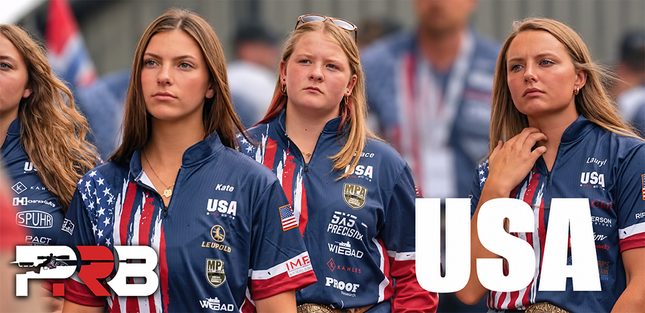
The original top three were Kate Estes, Lauryl Akenhead, and Grace Vaughn. That is also the halfway order using the recorded tiebreaker information! Kate has 90 impacts, Lauryl has 88, and Grace has 80. Estelle Boon also has 80, with Grace ahead on the tiebreaker.
Kate and Lauryl now have a combined 98.2% chance of winning, up from 53.0% before the match. The gap behind them explains why Grace can be exactly where the model ranked her and still see her winning probability fall from 13.8% to 1.4%. Being third and being close enough to win are two different things.
Senior

The model’s top four were Dale Rhoads, Lee Pettross, Allen Ernst, and Jason Aulwes. Those same four occupy the first four positions after Day 1. Dale and Lee are in the predicted order, while Jason and Allen have swapped third and fourth.
Dale’s 92 impacts give him a four-impact lead over Lee, and his winning probability has climbed from 31.7% to 70.7%. Jason has 84 and Allen has 83. Immediately behind them is one of the bigger surprises in the match: Robert Griffiths of the United Kingdom has 82 impacts and is fifth, against a predicted 21st in Senior.
Factory
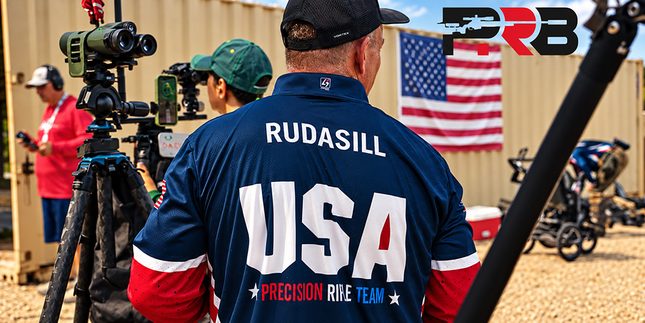
Keith Rudasill and Matt Caruso were the model’s first and third choices in Factory. They now lead with 96 and 94 impacts. Together, their winning probability has grown from 48.7% to 95.4%.
Dan Bertocchini was originally the second choice. He has 87 impacts, but Keith’s score puts him nine behind the leader. Dan’s chance of winning has consequently fallen from 22.3% to 1.6%. An 87% hit rate can sound very good until you put it beside the scores it has to beat.
South Africa’s Russell Ferreira is another substantial underestimate. The model ranked him 17th in Factory; he is fourth with 88 impacts. His winning probability actually declined slightly, even as he exceeded his predicted placement by a wide margin. Keith and Matt opened enough of a lead that Russell’s improved position did not translate into improved odds of taking the title.
Open
Austin Buschman, Morgun King, and Joe Pask share the lead at 95 impacts. Austin and Morgun were already among the favorites, but Joe was the model’s 14th-ranked Open shooter, with only a 1.35% chance of winning. He now has a 15.15% chance. The United Kingdom has a very real contender for the Open title.
The current tie does not give all three identical odds. Their scores so far are equal, but their historical evidence still contributes to the predictions about what happens next on the remaining ten stages. Austin is at 38.0%, Morgun is at 29.1%, and Joe is at 15.2%.
There are significant international surprises elsewhere in the leading group:
- Florian Laroumagne of France was predicted 64th in Open and is 10th with 89 impacts.
- Andrew Little of Australia was predicted 29th and is tied 6th on impacts with 90.
- Norway’s Jon Martin Haaland was predicted 45th and is 11th with 88.
The prediction model’s misses also go the other direction. Nowell Greasley was predicted 7th in Open and is tied 50th on impacts. Josef Sixt was predicted 8th and is tied 39th, while Anthony Collie was predicted 9th and is tied 26th. Clay Blackketter, the original favorite, has 90 impacts and remains in contention, but being five behind three leaders has reduced his winning probability from 19.3% to 4.3%.

Limited
Austin Orgain represents the largest drop in winning probability among the original division favorites. He entered with a 35.1% chance of winning, but his 74 impacts put him 7th and ten points behind Chad Heckler. Orgain’s updated winning probability is 1.4%.
The model’s 2nd and 3rd choices, Chad and Kyle McCormack, are much closer to their predicted positions. Chad leads with 84, and Kyle shares second on impacts with South Africa’s Willem Van Biljon at 83. Chad and Kyle now hold a combined 78.1% chance of winning.
Willem Van Biljon and fellow South African JC Robertson are the only shooters now above a 1% winning probability who were absent from the original published contender list. Willem has risen from 0.86% to 7.54%; JC, who has 81 impacts, has risen from 0.91% to 3.36%. Both were just below the original publication cutoff, but both have earned a larger place in this title race.
Junior
Junior has become a more competitive international title race than the original forecast suggested. Dylan Bailey of the USA and Johan Nel of South Africa share the lead at 87 impacts. Reagan Stahmer of the USA and Luke Anderson of Canada are just one behind.
Dylan now has a 30.2% chance of winning, Johan 21.6%, Reagan 19.6%, and Luke 12.7%. Johan’s probability was 6.9% before the match, while Luke’s was 5.0%. Those are meaningful changes based on what they have actually done here.
Gage Caples, the original favorite, is 5th with 83 impacts. His winning probability has fallen from 31.7% to 12.0%, so he still has a meaningful chance. Hunter Neal was the model’s 3rd choice, but his 73 impacts leave him tied 10th on score and his winning probability is now about 0.01%. The seven highest-scoring juniors were all on the original contender list. The model absolutely found the relevant group more successfully than it ordered the individuals within it.
How Team USA Compares With The Original Forecast
As I looked through the scores, it seemed like international shooters were taking more places near the top than the model had predicted. There is evidence of that: the original projected overall top 50 included 28 Americans. The updated projected top 50 includes 23.
But the division titles tell a different part of the story. An American currently leads or shares the lead in all seven divisions. Adding the individual winning probabilities for American shooters gives the following estimates:
| Division | Original chance an American wins | Updated chance an American wins |
| Open | 58.0% | 79.2% |
| Limited | 83.3% | 81.8% |
| Factory | 72.8% | 97.1% |
| Mil/LEO | 81.6% | 92.0% |
| Ladies | 73.7% | 99.6% |
| Junior | 69.1% | 61.8% |
| Senior | 84.0% | 99.9% |
American winning probabilities increased in five divisions, fell slightly in Limited, and declined more noticeably in Junior. The model’s expected number of American individual division titles rose from 5.23 to 6.11 out of seven. That is a sum of individual-title probabilities, not a forecast for the official national team competition.
International shooters have gained ground within the broader projected top 50 while several Americans have built strong positions at the very front of their divisions. Both observations can be true. The updated odds still incorporate the historical model, so the stronger test of the original predictions is the actual scoring, not simply whether the new model agrees with the old one.
The Biggest Individual Changes
The tables below show the largest upward and downward revisions in projected overall finish among previously ranked shooters who stayed in the same division. I’ve included their original division rank and actual Day 1 position so you can see the performance behind the revision.
These are obviously changes in forecasts, not final results. The original overall ranking ordered average simulated finishing positions among shooters with enough history to rank. The update orders expected final hit percentage across the full active field, including previously unranked shooters. Those differences also affect rank movement. In these tables, T means tied on impacts, before applying tiebreaks.
Shooters Exceeding Their Predicted Positions
| Shooter and country | Division | Day 1 hits | Division rank Original to actual | Overall rank Original to revised |
| Alejandro Fonseca Mexico | Open | 74 | 87 to T63 | 234 to 133 |
| Florian Laroumagne France | Open | 89 | 64 to 10 | 125 to 28 |
| Theis Egede Hendriksen Denmark | Open | 81 | 78 to T36 | 182 to 89 |
| Robert Griffiths UK | Senior | 82 | 21 to 5 | 186 to 98 |
| Russell Ferreira South Africa | Factory | 88 | 17 to 4 | 137 to 55 |
| Anders Hereid Norway | Mil/LEO | 82 | 17 to 8 | 147 to 79 |
| Johan Liebenberg Namibia | Open | 83 | 70 to T26 | 136 to 74 |
| Jon Martin Haaland Norway | Open | 88 | 45 to 11 | 88 to 27 |
| David Dedek Czech Republic | Factory | 82 | 21 to T10 | 157 to 96 |
| Brady Forgacs Australia | Limited | 69 | 35 to T10 | 233 to 172 |
Florian’s 89 impacts and Russell’s 88 put them close to the front of their divisions despite substantially lower predicted positions. Robert Griffiths is only one impact behind the 4th-place Senior shooter. Those are meaningful misses by the original model, not simply movement among shooters near the bottom of the standings.
Dennis Van Der Merwe deserves a separate mention. He was unranked originally because the model lacked a usable historical benchmark. He now has 87 impacts and is tied 12th in Open on score. That exposes a gap in the evidence we had before the match; there was no numerical prediction for him to beat.
Shooters Below Their Predicted Positions
| Shooter and country | Division | Day 1 hits | Division rank Original to actual | Overall rank Original to revised |
| Adam Borres Sweden | Mil/LEO | 38 | 13 to 28 | 121 to 245 |
| Ryan McLean Canada | Open | 63 | 24 to 83 | 48 to 155 |
| Sam Ruddenklau New Zealand | Limited | 34 | 17 to T38 | 172 to 265 |
| David Foster Australia | Open | 64 | 40 to T81 | 75 to 165 |
| Peter Gustafsson Sweden | Limited | 40 | 16 to 37 | 162 to 248 |
| Dawson Keen Canada | Mil/LEO | 63 | 8 to 18 | 90 to 174 |
| Scott McMillan Australia | Limited | 46 | 12 to 34 | 144 to 228 |
| Paolo Maddi Italy | Open | 30 | 79 to 96 | 184 to 268 |
| Rob Dunlea-Jones UK | Mil/LEO | 46 | 20 to T24 | 155 to 236 |
| Rasmus Andersen Denmark | Open | 47 | 74 to 89 | 156 to 237 |
These are comparisons with a statistical expectation. The scorecards alone do not explain why a shooter is below it, and they do not establish an equipment problem, a difficult personal day, or any other cause. There are also still 10 stages left, so they could change the outcome. Day 2 is moving day, right?!
One pattern worth noticing is that the ten largest upward revisions and the ten largest downward revisions both involve international shooters. A blanket adjustment that simply moved every international shooter up or down would not address both sets of errors. Uneven historical coverage and differences in how past results transfer to this field are plausible contributors, but one half of one match cannot separate all of that from normal variation in performance.
What This Tells Us About The Model
Across 230 previously ranked shooters who remained in their original divisions, the model correctly ordered 75.5% of the same-division head-to-head comparisons with different Day 1 scores. For example, when the model ranked one shooter ahead of another, that shooter currently has more points about 3/4 of the time. Comparisons tied on impacts were excluded. That is a useful check on the ranking, but it does not tell us whether every winning probability is accurate.
The absolute hit-percentage predictions deserve scrutiny, too. Those 230 shooters’ first-half hit rates averaged 16.2 percentage points above their original full-match forecasts. The first half produced a much higher scoring level than those forecasts anticipated. We still need the second half to judge the final hit-percentage predictions, and the different stage sets matter, but the original scoring assumptions clearly need attention.
The update uses the observed scores to revise those expectations. It also does not just assume everyone will repeat their Day 1 hit rate. Its remaining-half prediction structure was checked on 34 held-out matches and 3,351 shooter performances from 2026. Using root-mean-square error, which gives larger misses more weight, the remaining-half error was about 10.9 percentage points, compared with 12.3 points when simply repeating the first-half rate. That supports using the update, while leaving real uncertainty about international comparisons and any individual shooter’s finish.
Explore The Full Field
The spreadsheet accompanying this article has four results tabs: Updated Overall, Updated Divisions, Pre-match Overall, and Pre-match Divisions. The updated overall tab is sorted by projected final hit percentage, and the division tab includes winning probabilities for every active competitor.
The updated field contains 274 scored competitors; the original forecast preserves its 272-person roster. Four zero-score entries with partial scorecards are excluded from the active forecast. Previously unranked shooters now have first-half results to inform an estimate, although one half-match does not give them the same depth of evidence as someone with an extensive history.
The uncertainty ranges in the workbook are worth looking at alongside the rankings. A projected finish is an estimate, not a precise statement that one shooter will beat the next person in the table.
There are some very different races left to shoot. The three Open leaders are tied. The top four juniors are separated by one impact. In Factory, Keith and Matt have opened a gap on the rest of the field. Those are the positions the remaining ten stages will have to settle, and the full spreadsheet lets you see how much ground each shooter still has to make up.
Follow the official Impact Scoring results for scores posted after this snapshot.
Download Revised Predictions
Download Full Prediction Spreadsheet (Excel .XLXS file) (Includes all data, including the full pre-match predictions)
Download PDF of Updated Division Predictions (Shows the predicted rank by division, which is how titles and trophies are actually awarded)
Download PDF of Updated Overall Predictions (Shows the predicted rank and hit % across the entire field, regardless of division)




Hi there!
Thanks for this detailled update within the competition. As being the clear outlier in your forecast, I really believe that luck played a big role in day 1 ranking.
Let’s see how it goes day 2 ☘️
What is sure is that the true favorites shoot so well that they really deserve their places.
That was too many impacts to blame on luck! 😉 If that’s luck, you’ve clearly been practicing it.