Related Articles


As long-range shooters, we tend to obsess over every little detail. After all, we’re trying to hit relatively small targets that are so far you may not even be able to see with the naked eye. While you might can get away with minor mistakes and still ring steel at short and medium ranges, as you extend the range those small mistakes or tiny inconsistencies are magnified. So, most things are important … but to differing degrees.
There are so many variables that it’s easy to get lost, and most of us end up doing our best to spread our finite energy and resources in every direction. Is there a data-driven approach to help guide us toward the most important factors to increased hits at long-range?
I’m glad you asked! Bryan Litz created the WEZ (Weapon Employment Zone) analysis tool to gain some insight into this dilemma. So I dropped $200 for the Applied Ballistics Analytics Software Package, which allows you to run your own WEZ analysis. This gives you the ability to systematically study how different field variables in real-world shooting affect the probability of hitting long-range targets. Here is his summary of this software package:
“The Applied Ballistics Analytics software tool is a full-featured ballistics solver that includes the capability to compute expected probability of hit using the same Weapon Employment Zone (WEZ) method described in Bryan Litz’s book Accuracy and Precision for Long Range Shooting. This tool allows a shooter to see how his rifle can be expected to perform under a wide range of conditions, and how errors contribute in causing a bullet to miss its target.”
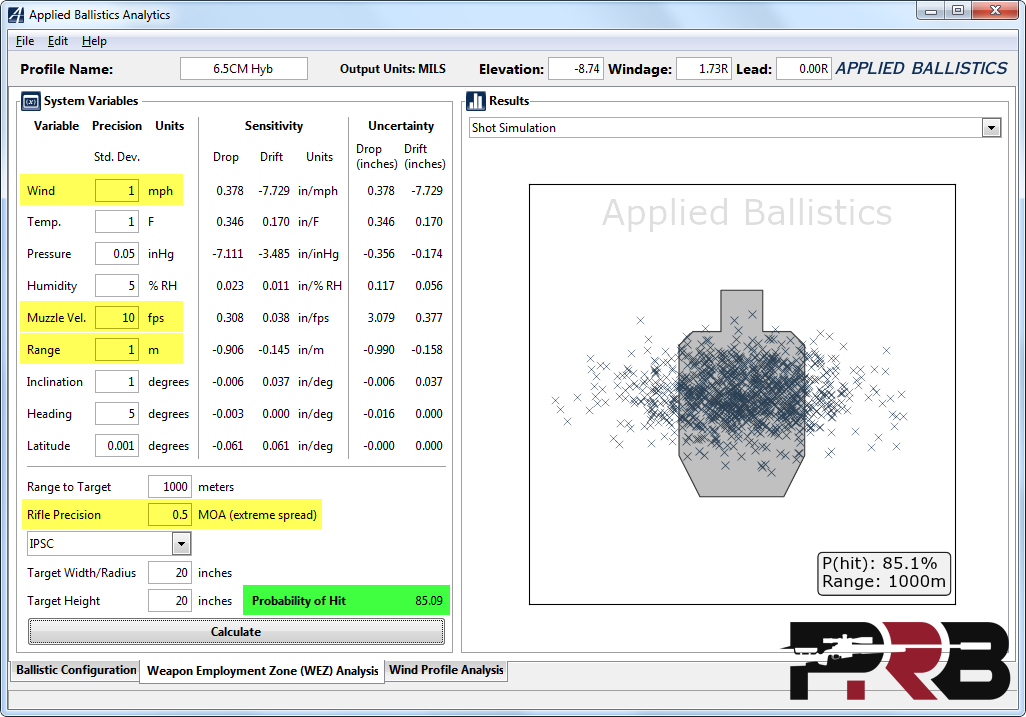
The WEZ tool appears to be doing what’s called a Monte Carlo simulation, which is a good way to model scenarios that have a certain level of uncertainty in the inputs. Monte Carlo simulations essentially play out hundreds or thousands of possible outcomes based on your inputs. The variables in each scenario are randomly populated within the ranges you set and according to a probability distribution. For example, if you gave some input that said your rifle was capable of holding a 0.5 MOA extreme spread, then it might play out one scenario where it drilled the exact point of aim, another where it hit 0.2 MOA high, another where it hit 0.25 MOA low, another that hit 0.12 MOA to the right, etc. Those shots would all still be within a 0.5 MOA group. It does that same thing for each of the variables in every scenario (muzzle velocity, wind call, range estimation, etc.), then it plays out each scenario, and plots where the shot would land. After it’s ran 1,000 different scenarios, it looks at the results of all of those and calculates your probability of hitting the target based on the variables you entered. Here is a screenshot of this part of the program, and I highlighted some of the key variables you can tweak.
I’ve played around with the WEZ tool a lot, and it was very enlightening! It challenged a lot of my long-held assumptions about how important different aspects were. As Bryan Litz said in his book, “Looking at each variable separately teaches us how to assess the uncertainties of any shot and determine how critical each variable is to hitting the target.”
The last post looked at what kind of impact group size had at long-range. In this post we’ll look at another element that we handloaders tend to fixate on:
How much does SD matter?
One aspect many of us handloaders chase after is really consistent muzzle velocities. That’s because if the muzzle velocity varies much, the faster shots will hit high and the slower shots will hit low. We often use standard deviation (SD) to describe how consistent our muzzle velocities are. I’ll try to not nerd out on you guys, but let me explain SD the quickest way I can. Standard deviation quantifies the variation in a set of data. Many shooters measure this by firing 10 shots over a chronograph, and then calculate the SD of that string of shots. A standard deviation closer to 0 indicates the muzzle velocities tend to be very close to the average, meaning they’re very consistent. A higher standard deviation indicates that the muzzle velocities are spread out over a wider range, meaning you can expect more shot-to-shot variation.
Okay, hang with me! Here is how SD applies to the real-world: You can see the common bell-curve below, which is known as a normal distribution. If you fire enough rounds, there is a very good chance your muzzle velocities will eventually form a normal distribution just like this. Since we know that’s what the distribution will eventually look like, we can use our 10 shot sample to estimate what the distribution would actually be if we fired 1,000 rounds. This is an approximation, but it’s a useful one. Each band in the diagram has a width of 1 standard deviation.
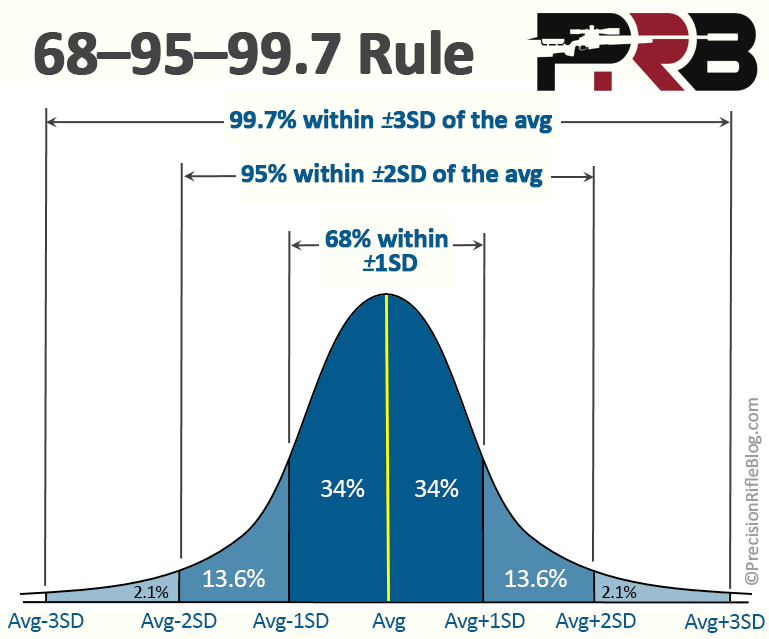
If you had a standard deviation of 10 fps for your muzzle velocity, that means 68% of your bullets would exit the muzzle within 10 fps of the average velocity. That is + or – 10 fps, so if your average muzzle velocity was 3,000 fps, then you could expect 68% of your shots to be between 2990 and 3010 fps. Note that the extreme spread of those muzzle velocities would be 20 fps, not 10 fps … because it is always + or – the SD number. We also know 95% of your shots will be within 2 SD’s of your average. So 2 × 10 fps = 20 fps, and again it is + or – that amount. So with an SD of 10 fps and an average of 3,000 fps, you could expect 95% of your shots to have a muzzle velocity between 2980 and 3020 fps. That means you’d have an extreme spread of 40 fps for 95% of your shots. Remember, 5% of your shots would still fall outside of that range, meaning they’d be below 2980 fps or above 3020 fps.
Now you should have the basics of how standard deviation defines variation of your muzzle velocities with a single number. Let’s turn to Bryan Litz to tell us what we should expect in terms of SD for muzzle velocity:
“Regarding available ammunition types, a Standard Deviation (SD) of 20 fps is considered relatively poor consistency, and is generally representative of mass produced factory ammo. 15 fps is considered better than average for factory produced ammunition, but still substandard for those who handload their own ammunition. 10 fps or less SD is typically the goal of most handloaders, and very few commercially available ammo suppliers are capable of producing ammo with SD’s under 10 fps.”
It’s relatively easy for a reloader to produce ammo with an SD of 15 fps, but you have to be meticulous and use good equipment if you want to wrestle that down into single digits. I have a friend who has handloaded ammo for his 6.5×47 Lapua and 338 Lapua with an SD of 3 fps across 10 shot strings! I’ve witnessed it with my own eyes, and he’s done on multiple occasions. 3 fps is the lowest SD I’ve ever heard of, but it takes exponentially more effort to creep down into those lower numbers.
Now that we have context for what you can expect, or what is typically the goal … let’s look at what impact shrinking our SD has on the probability of getting hits at long range.

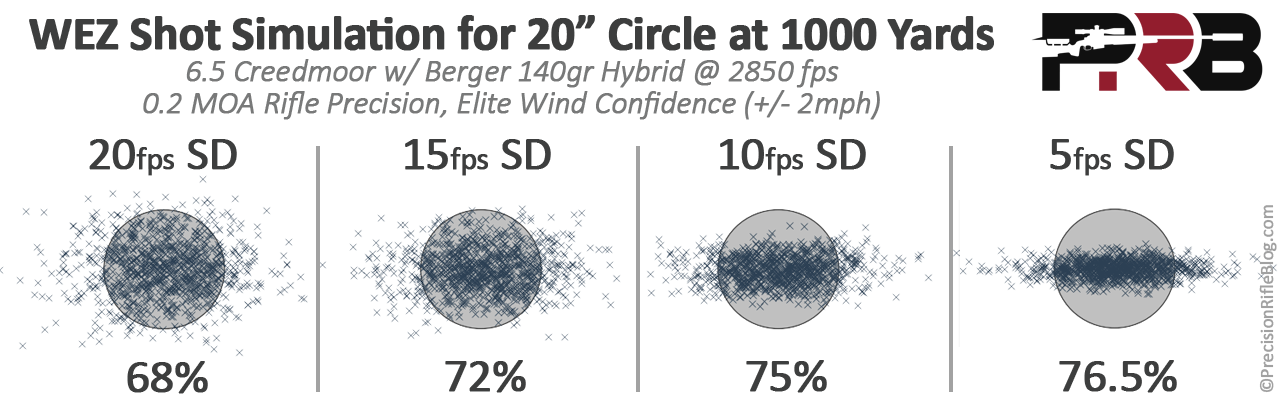
Lowering your SD has a slightly bigger improvement on the further target, but we can still see the point of diminishing returns as the lines start to level off. In these scenarios, there is a big 5% difference from 20 fps to 15 fps, but only 2.9% improvement from 15 fps to 10 fps, and then just a 1% improvement in hit percentage going from an SD of 10 fps to 3 fps! This is primarily because, once again, most misses at long range are caused by wind and not vertical dispersion. Bryan Litz says “If you’re missing the target for reasons unrelated to vertical dispersion, then reducing vertical dispersion won’t improve hit percentage very much.” Well, it makes a lot sense when you say it that way! You can see what I’m referring to in the shot simulations below. We’re shrinking the vertical spread, but most of our misses are because of the horizontal spread … so we’re simply not addressing the primary cause of the misses.
One last point to keep in mind, is that all of this analysis assumes you have centered groups. That means they represent the best case scenario for hit percentage, since your odds only decrease if groups come off center. If you’re scope isn’t zeroed, or your rifle is canted slightly to one side, or your scope’s clicks aren’t calibrated correctly, or you pull the shot … then your hit probability can decrease dramatically. But these simulations assume we have all that stuff squared away.
Other Posts In This Series
This post was one of a series of posts that takes a data-driven look at what impact different elements have on getting hits at long-range. Here are some others posts in this series:
- How Much Does Group Size Matter?
- How Much Does SD Matter?
- How Much Does Cartridge Matter?
- How Much Does Muzzle Velocity Matter?
- How Much Does Accurate Ranging Matter?
- How Much Does Wind Reading Matter?
- Overall Summary
If you want to dig more into this subject or explore some of these elements for your specific rifle, ammo, and ballistics, I’d encourage you to buy the Applied Ballistics Analytics Package to run these kinds of analysis yourself. You could also pick up Bryan’s Accuracy and Precision for Long-Range Shooting book, which has a ton of great info on these topics and other aspects of shooting.


Cal,
Great work, as always.
However, I’ve noticed that both this article and the last are dealing with the vertical and horizontal as if there’s no correlation.
Yes, the vertical dispersion is due to higher velocities hitting high, and lower velocities hitting low… it’s actually a function of time really and the amount of time gravity has to have an effect.
However, the horizontal dispersion is still a function of time. And that is the amount of time that the wind has (which the error is in how close one can dope the wind) to effect the trajectory. Ie. the lower the velocity, the longer time the bullet spends in flight, the more extreme the wind deflection will be.
Yelreak
Absolutely, Yelreak. That’s a great point. They’re both a function of time of flight. If you could launch a bullet that gets to the target in 0.0001 seconds, the wind wouldn’t have much of a chance to blow it off course. Right?! That’s exactly why you typically don’t hold for wind at 100 yards (at least in mild winds).
However, standard deviation of muzzle velocity is more correlated to vertical dispersion. If we were talking about a faster MV vs. a slower MV, yes … there would be slightly less horizontal dispersion for the faster MV. I will re-emphasize: slightly. As Litz says in his Accuracy & Precision book (page 72), “It is possible to increase hit percentage a noticeable amount by increasing barrel length and MV, BUT ONLY IF GREAT INCREASES ARE MADE. Increasing barrel length in 4 inch increments only affects hit percentage by a small amount (2%) at 1000 yards, and slightly more (4%) at 1200 yards.”
But this article wasn’t about the impact of faster MV (the next one will hit on that). This post is about how the consistency of muzzle velocity effects hit percentage, which primarily impacts vertical dispersion.
Thanks,
Cal
I am a big Litz fan and I agree with the posted simulations on both the effect of MOA accuracy and SD. However, it seems that this might potentially be a bit misleading. I am no statistian so bear with me a bit.
What I mean is the data in both simulations assumes 100 percent accuracy on part of the shooter/dope. What I mean here is the shooter/gun is assumed to point exactly at the center of the target and so all the shots are fired that way. In real life, this frequently does not happen. So for example, if the shooter’s dope is slightly off and he points the gun say 2/3 of the way down the target instead of ½ (i.e. perfect aim), will we see significant divergence in the hit percentage from less precise ammunition and ammunition with higher SD as significant number of those shots might be off the plate? Basically will the degree of “forgiveness” of the target is significantly reduced? Would love to see this simulation.
You’re exactly right. I had a note on that last post that the simulations assume centered groups, and I should add that to this one as well. They were originally one big article, but it was super-long. I knew nobody would read the whole thing if it was 10 pages long, so I edited it down and split it up into posts. I forgot to add that note on each one. Sorry for the tangent!
Yes, you’d have a higher margin for shooter mistakes if your groups were tighter than the required by the target. For example, if you were shooting at a 1 MOA target at 100 yards, and you had a 1/2 MOA rifle … You’d be able to pull the shot by 1/4 MOA in any direction and still hit the 1 MOA target.
Really, what I’m trying to do in these posts is give some data to help people see the point of diminishing returns, so each person can decide for themselves when it’s worth pushing for that next level of precision or consistency. I think the next post will really wrap all this together in a nice package, and provide some perspective on this as well.
As I mentioned in the comments on that last post, I’m not saying I’m happy with a 1 MOA rifle. I want the best I can get. But, I’m not going to continue to tweak my loads to get into the 1’s or even put much work into getting into the 2’s. I’m also not going to beat myself up or feel like a failure if my SD is 12 fps. There are just other factors in long-range shooting that overwhelm small incremental improvements like that.
Personally, I’m going to focus 100% of that time I used to spend tinkering with loads out at the range shooting in the wind, and the money I was considering spending on a Prometheus scale might go toward a training class with Accuracy 1st on reading the wind. Plus I’m going to add wind flags to my range to help me correlate those with what I’m seeing in terms of mirage, brush and grass movement, and dust movement from a bullet splash.
I’m not trying to sell that stuff, but just documenting my journey as I’m learning all this stuff. It’s not like I’m not going to try to make really good ammo when I’m handloading … I just think I have a more healthy perspective of how much that stuff matters compared to improvements to the nut behind the gun!
Thanks,
Cal
Thanks Cal – I think all of this has its place but I just don’t want a tactical shooter to come off reading these articles to think that group and SD tightness is not important.
There is a price to be pay for everything we do, the only questions for us are: 1) do we know what you are giving up when we spend our time doing x instead of Y? and 2) do you know what you are getting in return? We all have limited time and resources and so we really cannot do everything and so as long as people understand the consequences of their choices, it is all good.
BTW, love your blog!
Exactly! I’m just trying to help people see that, and provide the data so they can make an informed decision. Each of us will fall at different points in that continuum, and that’s okay. We’re all in different circumstances, which is why I’m not saying where the balance should be or saying you’re wrong if you want to spend the time to get 3 fps SDs.
It’s exactly like you said so concisely: 1) do we know what you are giving up when we spend our time doing x instead of Y? and 2) do you know what you are getting in return?
Great way to phrase that.
Thanks!
Cal
Wonderful concise analysis with good graphics. Review, reinforce, recoil, refocus, reap.
Your elimination of peripheral issues is really focusing our attention quantitatively on the best return for our time and money. Thank You
Your beautiful blog is a most enjoyable reading for me, at least for a half of year 🙂
Keep up great work!
Cal, i’m glad someone finally said it. i have the Litz books and have a loose understanding of his WEZ prediction tool.
we all knew there would be diminishing returns for weighing powder charges with precision going from .1gr ES to .01 ES, we just didn’t know how much.
sorting cases, sorting bullets by OAL, base to ogive, bearing surface length, etc, has it’s place but it may not be worth nearly as much as actually going out and learning to read the wind!!
let’s face it, missing that 4″ gong at 425 yards with a rifle that had a SD of 3 (or 5,15, etc) has very little to do with the precision of the loads/rifle. missing that switch on the other hand… does.
Yep, Tex. I’m with you. I wasn’t sure how much it mattered, but I’ve been reading back through Litz’s Accuracy & Precision book again, and finally thought I’d break down and buy his software package … and WOW! It is really, really enlightening being able to play around with the different variables. I feel like I learned more in an afternoon about what is the root cause of most of my misses than I have in years of shooting … and I was able to quantify it! As a data-driven guy in my very nature, that was motivating.
Thanks,
Cal
Hey Cal,
Have you ran these simulations on a 1moa target instead of 2moa? Since a lot of our targets are or are at least approaching 1moa on a fairly regular basis I would be interested in seeing the percentage jump then.
I think you will see a very significant drop in the hit percentage if the targets were 1MOA. That was my point in the 3rd post to this thread…
Yep. Long distance 1 MOA targets with any wind is a low percentage shot (for 1st round hit, any idiot can walk a bullet onto the target) … regardless of how good your ammo or rifle is. Once again … 99% of us aren’t shooting at 1 MOA targets. I know it always feels like the targets are small … but they’re not that small. I’ve shot in a lot of competitions, and I can count on one hand how many 1 MOA targets have been in those. It’s just such a hard shot if you have any wind. You should buy the app and run the numbers … it’s very, very low.
Thanks,
Cal
Hey, Scott. Great question. The 10″ target at 700 is a 1.36 MOA target, but as you shrink to sub 1 MOA targets at distance EVERYTHING starts to matter … although wind remains the primary cause of misses (except in no wind conditions obviously). You want every advantage you can get with those sub-MOA targets. There aren’t a lot of shooters in the world who can make that shot at distance, but I realize you’re actually one of those guys!
This is really aimed at guys like me who aren’t one of the top 50 shooters in the country. 90% of us should focus on being able to read wind better, and not be distracted by this stuff until we’ve gotten reasonably good at that primary cause of misses. But once you get good at wind calls, you should certainly start to look at these secondary elements. You’re definitely there … I’m definitely not. My goal is to be there before they put me in an old folks home!
The next post will address the target size thing in a little more context. I give the numbers for an 8″ target at 1000 yards, and it helps you see the effect on those small targets. But once again, man that’s a hard shot for a first round hit … very few can make that shot, but if you’re going to … you need any advantage you can get because it’s still a low percentage shot with any wind.
Thanks,
Cal
Hey just something to add, that’s not 20″ circle in the program. That’s a 20″ radius.
So that’s a 40″ circle. You’ll see the data will really change when you run a target that’s not 4 MOA.
Ryan, you’re exactly right. I also noticed one other part of the calculations that weren’t inline with how Bryan ran the simulations in the book, so I’ve gone back and updated all of the posts to address both issues. Honestly, they both kind of worked in opposite directions, so the correction wasn’t as dramatic as I expected. But I really, really appreciate you catching this. When I first started using the program, I noticed the labels that said that was “Target Width” and “Target Height” and thought it was confusing that it called one of those radius. It didn’t appear to be working that way, but after further investigation you’re absolutely right. So I re-ran all the calculations, and the posts have been updated. I tested the calculations against known “correct” simulations in Bryan’s book, and they now align very well. So I’m confident they now reflect his intended modeling.
I’m not sure it changed the patters or point of diminishing returns in a significant way, but it does help me sleep better at night knowing the numbers are correct. I’d honestly rather this website be shut down, rather than publish bad info. The market is already saturated in websites that publish bad info! As soon as I noticed this was a real issue, I knew I wouldn’t be able to go to sleep until it was fixed.
Thanks again, Ryan, for keeping me on my toes! I sincerely appreciate it.
Thanks,
Cal
Reblogged this on Amputee Shooter and commented:
I have been reading a lot on ballistics recently, and standard deviation has come up as being important – here is a great post explaining the importance of it across multiple ranges.
Chronograph your loads. From the start.