Related Articles


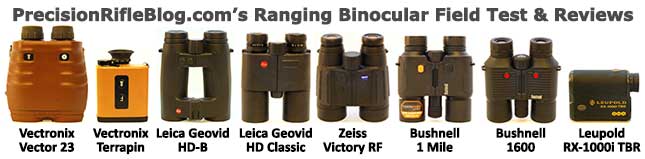
This is one of a series of posts about the results of field tests on rangefinding binoculars. Here are the models included in the test:
- Leica Geovid HD-B 10×42 (View Full Review)
- Leica Geovid HD Classic 10×42
- Zeiss Victory RF 10×45 (View Full Review)
- Bushnell Fusion 1 Mile 10×42 (View Full Review)
- Bushnell Fusion 1600 10×42
- Vectronix Vector 23 (View Full Review)
- Vectronix Terrapin (View Full Review)
- Leupold RX-1000i
I hear so many people claim there is no way to objectively test optical clarity, because everyone’s eyes are different, so you just have to look through each pair for yourself. My rebuttal to that is this: “Okay, even if that’s the case … couldn’t you test several people and then average the results?” That would at least give you an idea of whether a set of optics will be more or less likely to be clear and sharp for someone’s special unique eyes.
The idea for testing and trying to quantify this came when I was shooting in the Sporting Rifle Match at the NRA’s Whittington Center a couple months ago, and I saw a mule deer buck 700 yards away. I was viewing it through the Zeiss Victory RF 10×45 binoculars and was straining to try to count how many points he had. One of my friends was carrying the new Leica Geovid HD-B 10×42 binoculars, and I asked if I could borrow them. When I raised them up, I could immediately see more detail than I was able to with the Zeiss pair. It wasn’t a lot, but at that particular distance, even a little more clarity went a long way. I could actually count the points with the Leica pair, where I couldn’t with the Zeiss. In that moment, I knew I had to find a way to objectively quantify optical clarity between these different models.
I spent a lot of time trying to come up with a data-driven approach to optical clarity, and what I ended up with was a clever, original approach to testing optical performance (at least I’ve never heard of someone using this approach). This is a field test, not a laboratory test … and I’m not claiming it is 100% perfect. But, at the very least it gives you something to go on that is based on more than someone’s opinion.
The Optical Performance Field Test
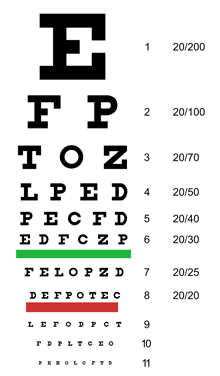
What I came up with is placing large Snellen eye exam charts at 600, 800, 1000, 1200 and 1400 yards. These are very similar to the charts used at an eye doctor’s office, which they use as a tool to assess visual acuity by determining how much detail and definition you can make out at a particular distance. The letters on the charts I made were 3, 4½, 6, 7½, and 9 inches in size, with two or three rows of different sized letters on each chart. Snellen determined a person with normal visual acuity was able to read his special “optotype” letters at a distance of 20 feet when they are subtended to 5 MOA. This became known as 20/20 vision. So I calculated how large a letter should be at each distance to appear to be 5 MOA when viewed through 10x magnification, and then printed letters on each chart that were slightly larger, some right around that 20/20 vision size, and on the targets 1,000 yards or less I added a line of letters that were a little smaller than 5 MOA.

To keep one person’s vision from skewing the results, I asked two of my friends who have great vision to help me with this test. One of them wore prescription glasses and the other didn’t. I asked each of them to take one set of optics at a time and try to make out as many of the letters at they could on every chart, and I recorded exactly what letters they called out. The letters on the charts were all scrambled, so there weren’t any repeating patterns that an observer could memorize. Later, I compared what they called to what the letters actually were on each chart, and came up with the accuracy percentage each person was able to get for each line, on each chart, with each model of optics.
I wanted to try to convert those results into a score or index that could be used to objectively rank the optics relative to one another. So I weighted the percent each person was able to accurately read on each line by how big those letters were compared to 5 MOA. That meant if they were able to read the tiny row of letters on a chart that would count more than if they could only read the larger row of letters.
Without further ado … here are the overall scores that fell out of those calculations:
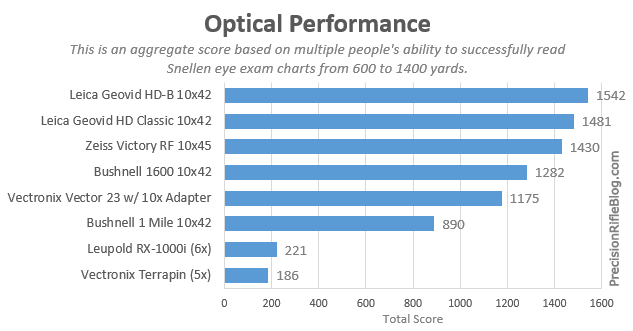
The Leica Geovid binoculars led the pack, with their new Perger-Porro prism HD-Bs edging out the original HD model (I’ll typically refer to it as the HD Classic for distinctness). Conventional wisdom has said that a roof prism like what those used on the original Geovid HD and the Zeiss Victory RF should provide a better image, but Leica’s new Perger-Porro prism out-performed all of them. The Zeiss Victory RF was not far behind Leica. I consider all three of those top performers and roughly in the same class of clarity, although there was obviously a noticeable difference between them.
Coming in at #4 was a surprise in the Bushnell Fusion 1600 binoculars. The glass in those was really impressive. These were the model before the newer Bushnell Fusion 1 Mile came out, and it was obvious with the two side-by-side that the glass in the newer model we tested wasn’t quite as sharp as the 1600s. Now, you will see in my next post that the Bushnell 1 Mile binoculars had amazing ranging capabilities and was able to range out to 1760 yards, where the 1600s struggled with ranging past 800 yards. If you could combine the glass from the 1600s and the ranging capabilities of the 1 Mile, you’d have a show stopper … especially for the price.
Remember the Leupold RX-1000i and the Vectronix Terrapin are both monocles, and have 6x and 5x magnification respectively. I included them here because I’ve heard more than one person say there were considering just carrying a monocle with them, in place of binoculars. The problem is the magnification on those units just isn’t enough to be able to locate targets or game in some situations. On our range we have an unknown distance target field where we move the targets around a lot. One of my friends was using the Terrapins to locate and range targets, and thought he’d found them all. However, when he raised up his Leica HD-Bs he immediately saw a target that he had completely overlooked with the Terrapins. Don’t get me wrong, the Vectronix glass is world-class … it just doesn’t have enough magnification to use them as your primary optic in the field situations I find myself in regularly.
Optical Spec Comparison
Here are a few charts that illustrate how the rangefinders compare for some of the major optical specifications:

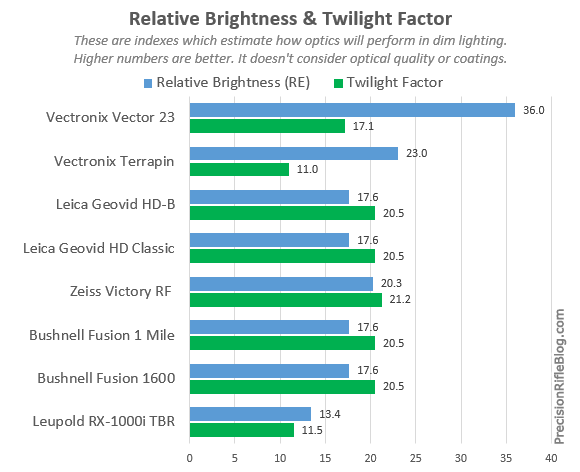
Relative Brightness is a rough guide to image brightness, and used to estimate how well binoculars with different size exit pupils will perform under low light conditions. It is based on the size of the exit pupil, which is the size of the circle of light coming out of the eyepiece of the binoculars. The bigger that circle of light is … the brighter the image (at least to a certain point). Binoculars.com says “This index reminds us that as the size of the exit pupil increases, its area and ability to transmit light grow geometrically.” If the relative brightness value is below 15, the optics will likely struggle in anything but bright light. If relative brightness is over 25 it will likely be exceptional in low light conditions.
Twilight Factor is a rough estimation of the resolution or amount of detail that can be seen in dim light conditions. It is a little different, because it is based on the magnification and the size of the objective lens (the large lens that collects the light). This measurement largely favors magnification, presumably because increased magnification can somewhat make up for the decrease in brightness in “twilight conditions” (when the eye is not yet fully dark-adapted), according to ChuckHawks.com.
Both of these factors are completely based on the dimensions and magnification of the optics, and don’t take into account factors such as optical quality or coatings which can also play into image brightness and resolution.
To see how the full list of specs compare side-by-side, check out The Models & Specs post.
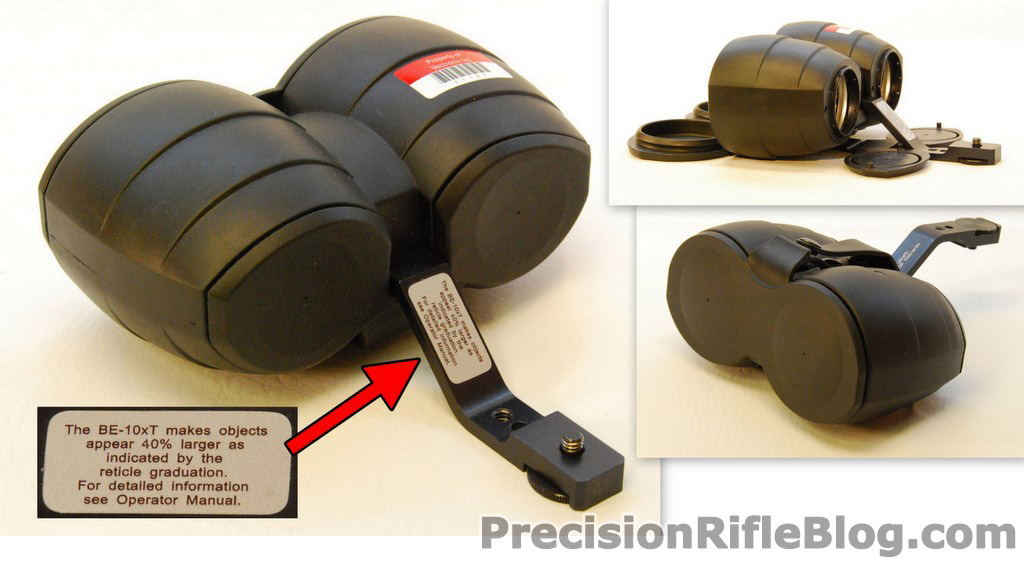
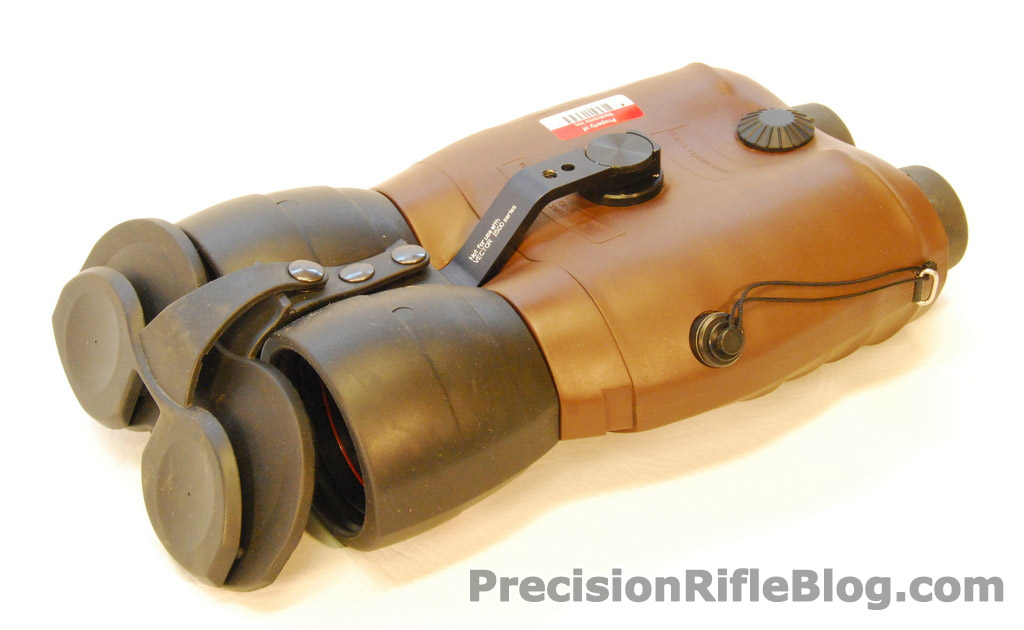
Vectronix Vector 23 BE10 Magnifier
For then optical tests, I used a special accessory (BE-10xT) on the Vectronix Vector 23 binoculars to bring their 7x magnification up to 10x. It essentially just screws into the tripod adapter on the bottom of the binoculars. The glass is amazing, and for being an external adapter, I was impressed with the overall clarity. However, the extra glass does make them heavy. The Vector 23 weighs 4.0 lbs., but with the BE10 attached, it weighs in at a hefty 6.3 lbs.
More About The Optical Score
The basic idea is that two observers were awarded points for each letter they called correctly, and the smaller the letter was the more points it counted for. The final score was a combination of lots and lots of letters being read at long distances.
It’s easiest to explain how the details of how the scoring worked through an example. Let’s start with the 800 yard chart. The first step is determining what size the letters would need to be at 800 yards to match Snellen’s 20/20 vision. We know Snellen’s mark for 20/20 vision is being able to read 5 MOA letters, so how big is 5 MOA at 800 yards?
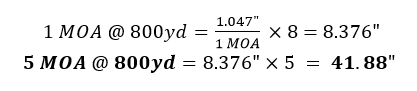
Since we are going to be viewing those letters primarily through 10x magnification, we need to shrink that by 10x to get to what appears to be 5 MOA when viewed through the binoculars.
![]()
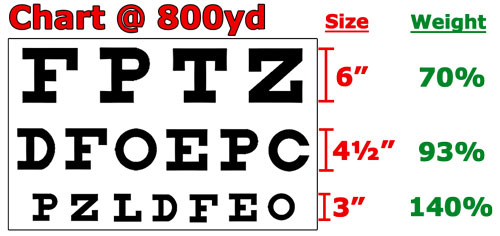
Now here is the 800 yard chart, along with the actual letter sizes of each row. It also gives the weight the score will count for on each row. Essentially a letter that appeared to be exactly 5 MOA in size would be 100%, and anything larger would count less, and any letters smaller would count more. Since we know 100% would be 4.188” from the calculations above, the 4.5” letters are pretty close to the adjusted 5 MOA. The 6” are bigger, and the 3” are considerably smaller. The weights were calculated by simply taking the adjusted 5 MOA size divided by the actual letter size. So for 6”, it would be 4.188 / 6 = 70%. Then the other calculations are 4.188 / 4.5 = 93%, and 4.188 / 3 = 140%.
Observer #1: Let’s say the first observer called all 4 of the large letters correctly, and called all 6 letters in the middle row correctly as well. They weren’t able to make out any of the letters in the bottom row.
Observer #2: The second observer was able to call both the top and middle row 100% accurately as well, but they were also able to make out 3 of the 7 letters in the bottom row.
Here are those results in tabular form along with the score calculations:
|
Row |
Letter Size |
Score Weight |
Observer |
% Correct |
Score |
|
Top |
6” |
70% |
#1 |
100% |
100 Points x 70% Weight x 100% Correct = 70 |
|
#2 |
100% |
100 Points x 70% Weight x 100% Correct = 70 |
|||
|
Middle |
4½” |
93% |
#1 |
100% |
100 Points x 93% Weight x 100% Correct = 93 |
|
#2 |
100% |
100 Points x 93% Weight x 100% Correct = 93 |
|||
|
Bottom |
3” |
140% |
#1 |
0% |
100 Points x 140% Weight x 0% Correct = 0 |
|
#2 |
43% |
100 Points x 140% Weight x 43% Correct = 60 |
So the total score for both observers on this chart would add up to 386 points. This example was actually the exact results found when using the Leica Geovid HD-B binoculars.
This scoring process shown here for the 800 yard chart was repeated for the charts at the other distances (600, 1000, 1200, and 1400 yards). The letters on the charts were all scrambled, so there weren’t any repeating patterns that an observer could memorize. I strictly used the 10 Sloan letters seen on typical Snellen charts, which are the special optotype letters that are similar in shape and difficult to distinguish between. The scores from all the charts were then summed together, and the result was the score shown in the chart for that model.
It is a fairly simple approach, but don’t get lost in the details. Remember, the whole idea here was to objectively quantify optical clarity between these different models. It is even more helpful if that can somehow be represented with a single number, which is what the scoring attempts to do. Although this approach may not be perfect, it is informative and data-driven. I hope it helps.
Other Posts in this Series
This is just one of a whole series of posts related to this rangefinder field test. Here are links to the others:
- How Do Rangefinders Work? From Basics To Advanced Features
- The Models & Specs
- Optical Performance Test Results
- Ranging Performance Test Results
- Overall Results Summary
While performing the field tests I used each model to range 500 times on average … so I used them a lot. I also asked two of my close friends to use them, and I took notes on what we did or didn’t like about each of them. I transformed those notes and the test results for each model into comprehensive reviews for each model. I also took a bunch of high-res pictures of each model and have a photo gallery of each posted along with the review. Check them out:
- Vectronix Vector 23 Review
- Vectronix Terrapin Review
- Leica Geovid HD-B Review
- Zeiss Victory RF Review
- Bushnell Fusion 1 Mile Review


Great job decerning a quantitative way to judge optical clarity.
I think of you (we?) repeated this test with a couple more users and 10x binoculars (non range finding) you’d have people knocking on your door to publish it and/or draw a lot of site traffic for a long time.
I can’t wait for the same style review of riflescopes.
Good work.
Thanks.
Thanks for the comments David. I’m glad you found this helpful. I’ve thought about doing this same kind of data-driven testing for other optics, but honestly … it might be a couple months before I recover from this one! This ended up being A LOT of work … way more than I expected when I started out. The ranging tests I did were even more in-depth (be sure to check out that post in about a week). I’m sure time will heal the scars, and I’ll be up for another big field test like this pretty quick.
I was thinking if I did another one, it might be optical clarity for high-end rifle scopes. I’d especially like to quantify things like how bright the optics were in low-light conditions with various objective lens diameters. Can you tell more detail with high-quality glass at lower magnification? How much clearer is a Schmidt & Bender scope than one of the new Bushnell tactical scopes? How do the Vortex scopes compare to more established brands like Nightforce or Leupold? Hard numbers for that kind of stuff would be pretty nice to have.
All readers: Are there any other ideas for tests like this you guys would like to see? Just add a comment here with your ideas.
Excellent work, thank you Cal. I appreciate the thought you put into developing a system to test this units fairly.